> ## Documentation Index
> Fetch the complete documentation index at: https://docs.alginte.com/llms.txt
> Use this file to discover all available pages before exploring further.

# The app at a glance

> Your first five minutes: the Overview dashboard, how the sidebar reflects your configuration, the health indicator, and the About panel.

## The Overview dashboard

**Home** is a cluster dashboard: the cluster id in the header, and a
collapsible state card per area — Brokers, Topics, Consumer Groups, Streams,
and (when configured) Connect and Schema Registry. Each card's numbers are
the area's vital signs — under-replicated or offline partitions, consumer
groups by state, stream deployments by state, failed connector tasks — and
each card's title jumps straight into its area. **Refresh** re-pulls
everything.
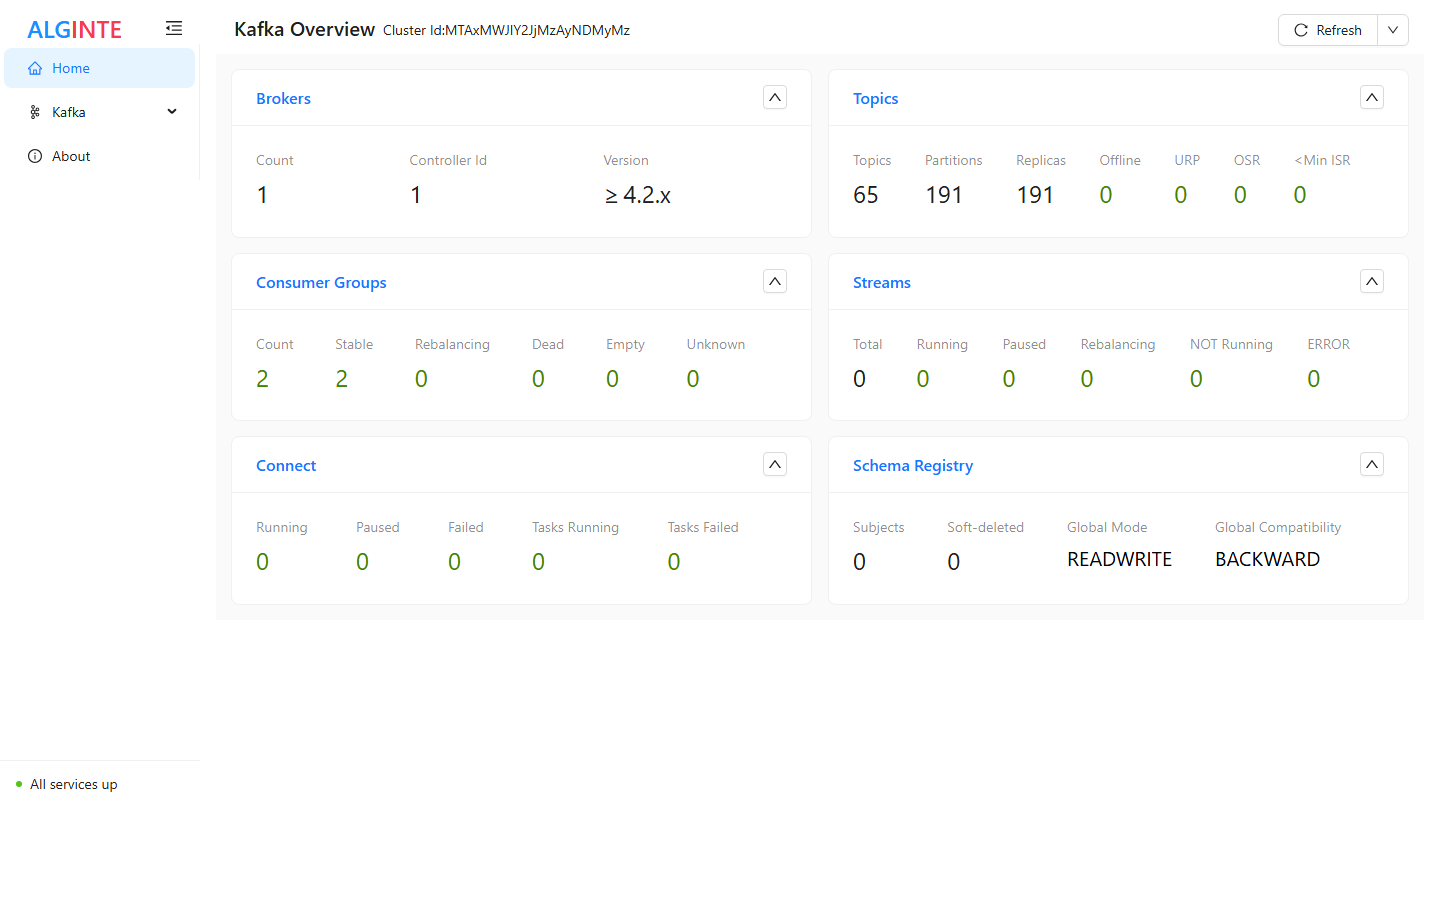
<Frame caption="The Overview dashboard: one state card per area, each linking into it.">
  <img src="https://mintcdn.com/alginte/_UxuwCDWaouPrOuk/images/kafka-overview.png?fit=max&auto=format&n=_UxuwCDWaouPrOuk&q=85&s=3cc259efcd05924cd3ab0ea3bba4e2f9" alt="The Kafka Overview dashboard with state cards for brokers, topics, consumer groups, streams, Connect, and Schema Registry" width="1440" height="900" data-path="images/kafka-overview.png" />
</Frame>

A quick triage habit: anything non-zero in the red-flag columns — *Offline*,
*URP* (under-replicated), `<Min ISR`, consumer groups *Dead*, streams
*ERROR*, connector *Tasks Failed* — deserves a click before anything else.

## The sidebar reflects your configuration

The **Kafka** menu always offers Brokers, Topics, Consumer Groups, Schema
Registry, and Streams. Entries for *optional* upstreams — **Connect** and
**ksqlDB** — appear only when the corresponding service is
[configured](/operate/configuration); an entry you don't see isn't missing,
it's switched off. The same rule governs the Overview cards.

## The health indicator

The bottom of the sidebar carries a live service-health dot — **"All services
up"** when Alginte can reach everything it's configured for (the Kafka
cluster and any optional upstreams). When something becomes unreachable, the
indicator degrades and names the affected service — Alginte keeps running and
the unaffected areas keep working. This is the *in-app* view for humans;
containers and probes should use `/actuator/health` instead (see
[Production](/operate/production)).

## The About panel

**About** answers "what exactly am I running?":

* **Version and build info** — the release version and build timestamp;
  useful in any support conversation.
* **The update notice** — when the [update check](/operate/updates) is
  enabled and a newer release exists, it appears here.
* **License** — the edition this instance runs:
  [Community](/editions/licensing) shows keyless/no-key state; a Professional
  key (once available) shows its status here.
