
The Overview dashboard
Home is a cluster dashboard: the cluster id in the header, and a collapsible state card per area — Brokers, Topics, Consumer Groups, Streams, and (when configured) Connect and Schema Registry. Each card’s numbers are the area’s vital signs — under-replicated or offline partitions, consumer groups by state, stream deployments by state, failed connector tasks — and each card’s title jumps straight into its area. Refresh re-pulls everything.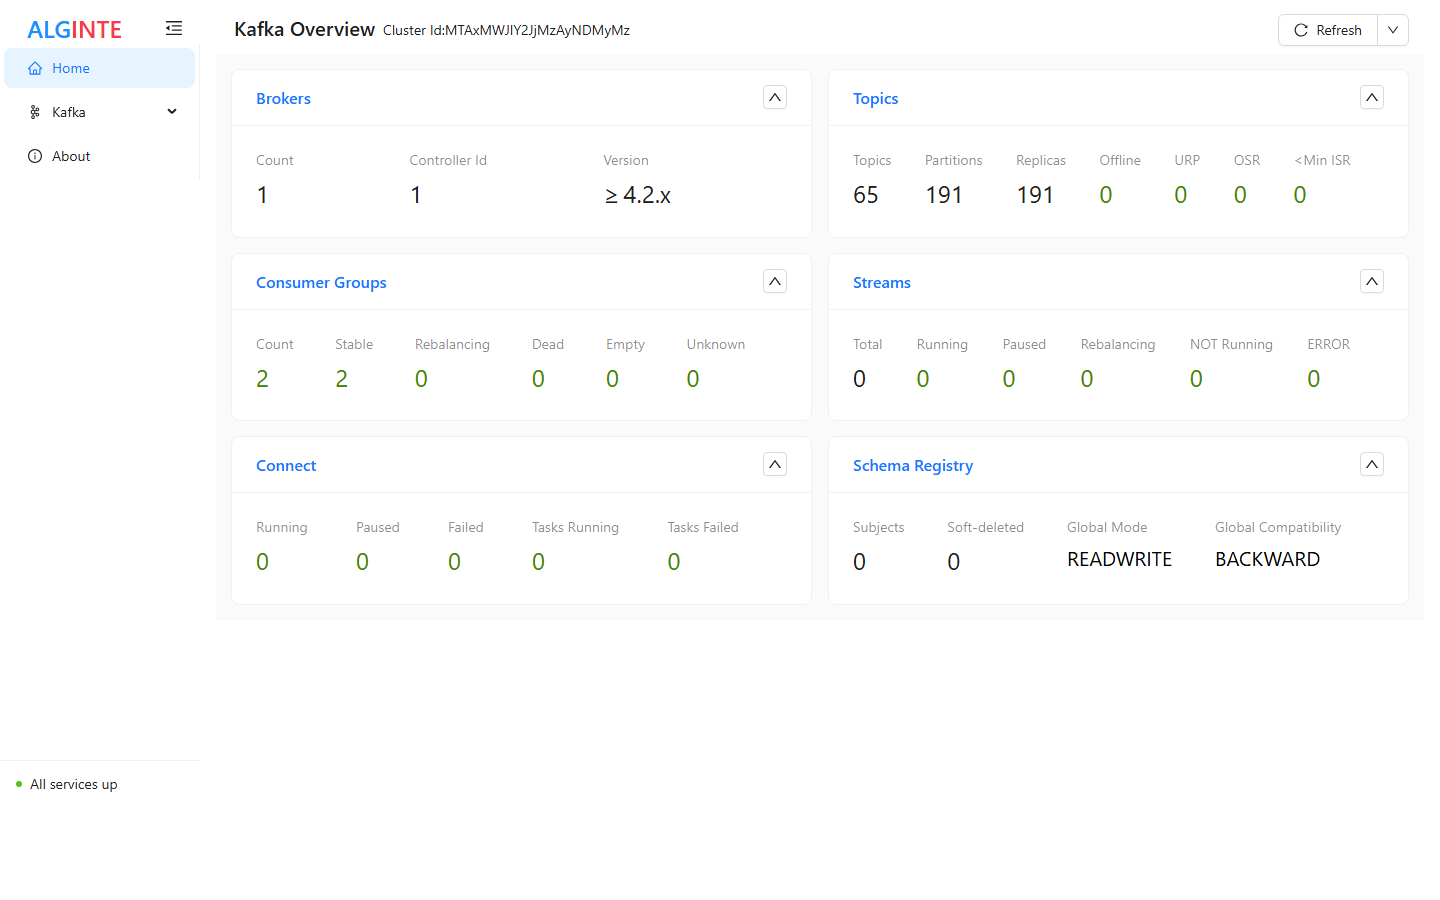
The Overview dashboard: one state card per area, each linking into it.
<Min ISR, consumer groups Dead, streams
ERROR, connector Tasks Failed — deserves a click before anything else.
The sidebar reflects your configuration
The Kafka menu always offers Brokers, Topics, Consumer Groups, Schema Registry, and Streams. Entries for optional upstreams — Connect and ksqlDB — appear only when the corresponding service is configured; an entry you don’t see isn’t missing, it’s switched off. The same rule governs the Overview cards.The health indicator
The bottom of the sidebar carries a live service-health dot — “All services up” when Alginte can reach everything it’s configured for (the Kafka cluster and any optional upstreams). When something becomes unreachable, the indicator degrades and names the affected service — Alginte keeps running and the unaffected areas keep working. This is the in-app view for humans; containers and probes should use/actuator/health instead (see
Production).
The About panel
About answers “what exactly am I running?”:- Version and build info — the release version and build timestamp; useful in any support conversation.
- The update notice — when the update check is enabled and a newer release exists, it appears here.
- License — the edition this instance runs: Community shows keyless/no-key state; a Professional key (once available) shows its status here.