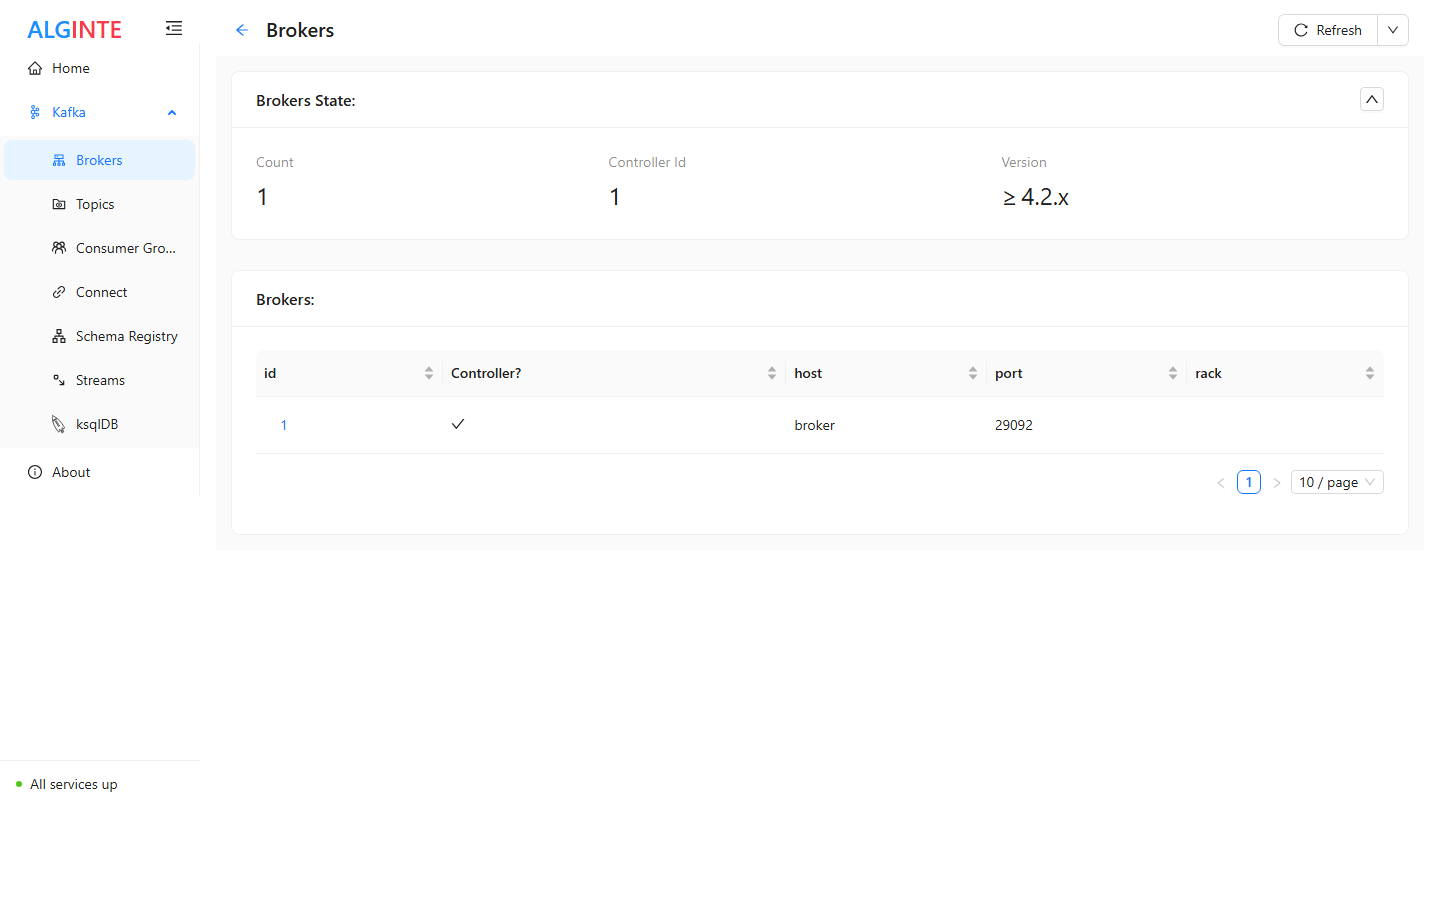
The Brokers page shows the cluster at a glance: a state card (broker count, controller id, protocol version) and a table of every broker — id, controller flag, host, port, rack — each row linking to the broker’s detail page.
The Brokers page with the state card and a broker row marked as controller

The Brokers page: cluster state card and the broker table.

There is deliberately no create action here: brokers are a cluster-managed resource — you add nodes by operating Kafka, not from a UI.

The broker detail page

Three tabs:
  • Info — the broker’s identity and role (id, host, port, rack, controller status).
  • Config — the broker’s effective configuration, searchable — the place to answer “what is log.retention.hours actually set to on this node?”.
  • Topics/Partitions — which partitions this broker hosts and its role for each (leader or replica) — the view you want when asking “what lives on this node?”.

Triage: from a red flag to a broker

The Overview dashboard’s red-flag columns often end here: a non-zero URP (under-replicated partitions) or Offline count means some broker isn’t holding its share. Check which broker is missing from the affected partitions’ ISR on the topic’s Partitions tab, then open that broker’s Topics/Partitions tab to see the blast radius of the node.