
The State tab and observed streams require Alginte 0.11.0 or newer. The per-node badges
on the canvas require 0.8.0 or newer.
Which view you get
- Deployed in Alginte. The console hosts the Kafka Streams client and reads it directly, no agent and no scraping: restore progress, store and changelog lag, thread state, rebalances and events, plus the cluster’s own facts beside them. This is the State tab and the Stream Flow badges, everything below.
- Running elsewhere, on a cluster this console reads. The console never touches the application; it reads what the cluster alone says about it, with read-only rights: group state and size, committed offsets and lag, the changelog topics and how far they reach. Thread state, restore progress and store sizes are not visible at this depth and are shown as absent. This is the Observed on the cluster table and the observed page.
- Running elsewhere, reporting its own state. Coming. An application you run outside Alginte
can push the same state a hosted stream shows, thread state, restore progress and store sizes
included, through a small open-source reporter library added to the application, one call
before
start(). The console side, the observations endpoint under a bearer token, is in 0.11.0 and documented on the configuration page; the library follows. Until it does, such an application is shown at the cluster-only depth above.
The State tab
Open a stream’s detail page and switch to State. The tab is one snapshot of the stream as its observer sees it, plus the events that led there.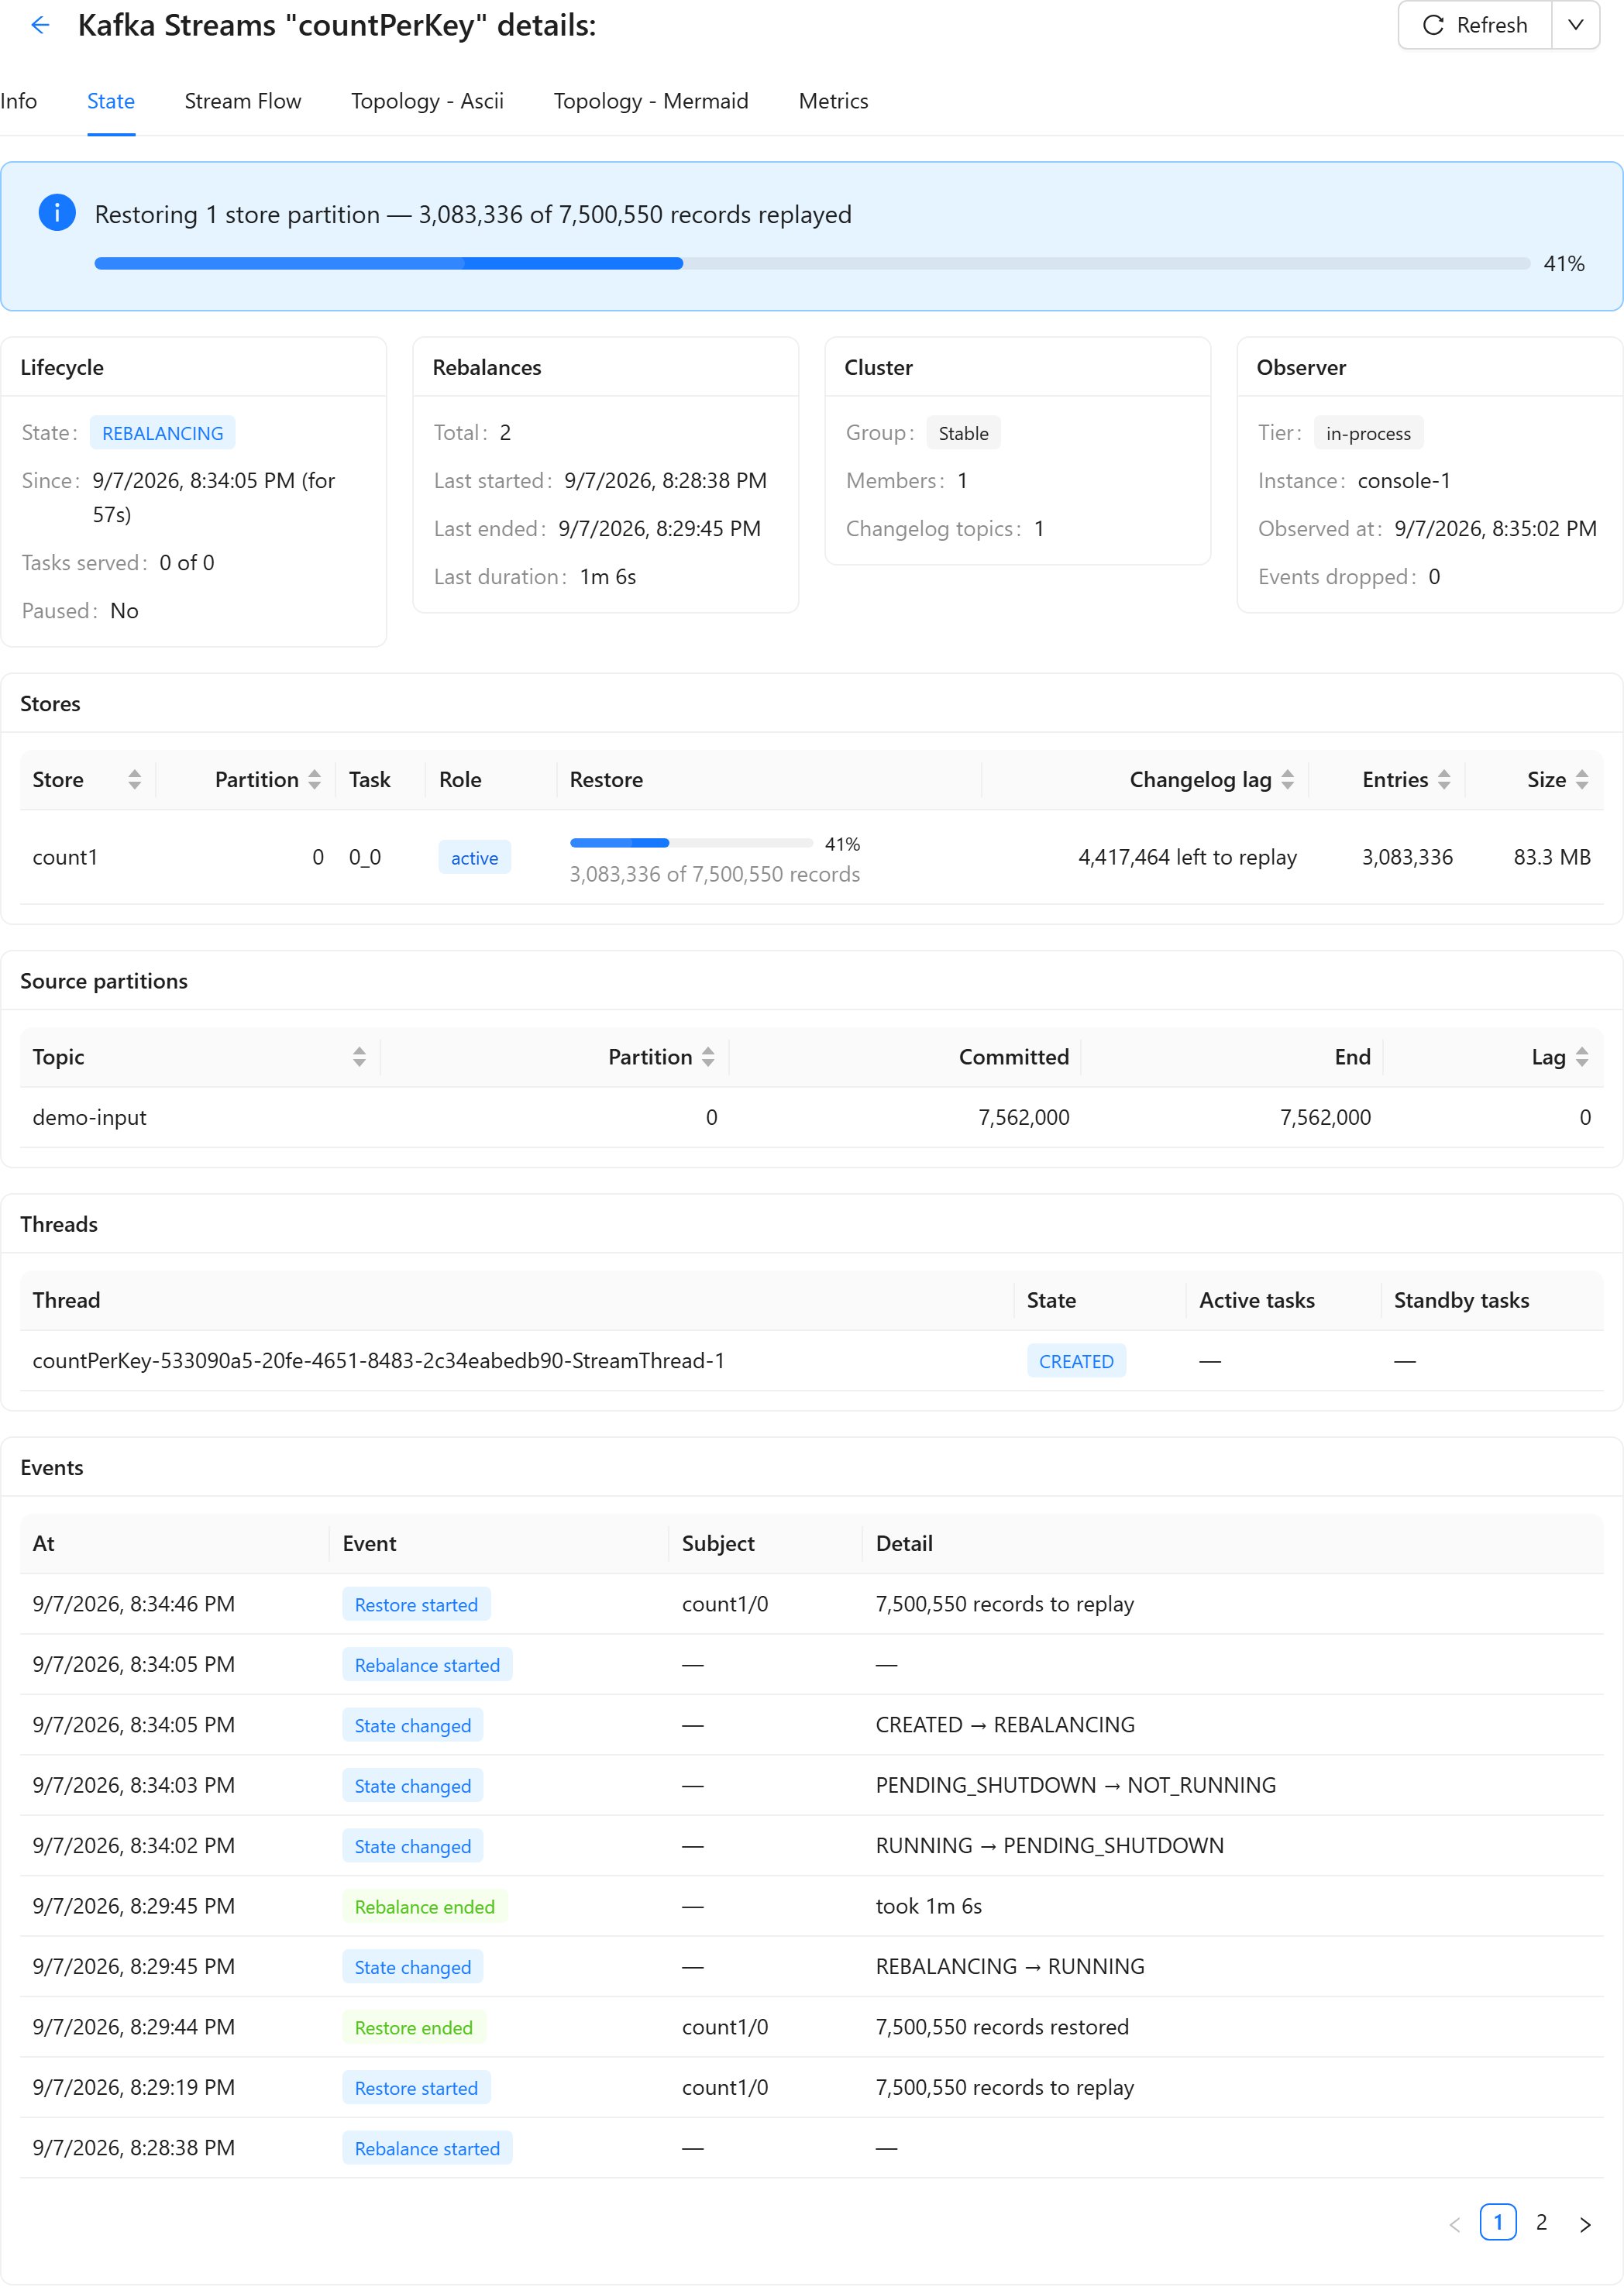
A stream restoring a 7.5M-record state store after its state directory was wiped: the restore banner, the lifecycle reading REBALANCING with 0 of 0 tasks served, and the store row's lag counting down.
- Kafka says
REBALANCINGforever while every stream thread is dead. The console reads that as ERROR. - Kafka says
RUNNINGwhile threads died and were replaced faster than the client noticed, so some tasks are assigned but nobody serves them. The console reads that as DEGRADED, and Tasks served shows the shortfall in red,3 of 6.
Streams you did not deploy here
The Streams page ends with Observed on the cluster: every Kafka Streams application the cluster knows about, whether or not this Alginte instance runs it. The console finds them by the signs Kafka Streams leaves behind: a streams-protocol group, a consumer group whose members carry theStreamThread client id, or an internal -changelog or -repartition topic, which is how a
stopped stateful application is still listed.
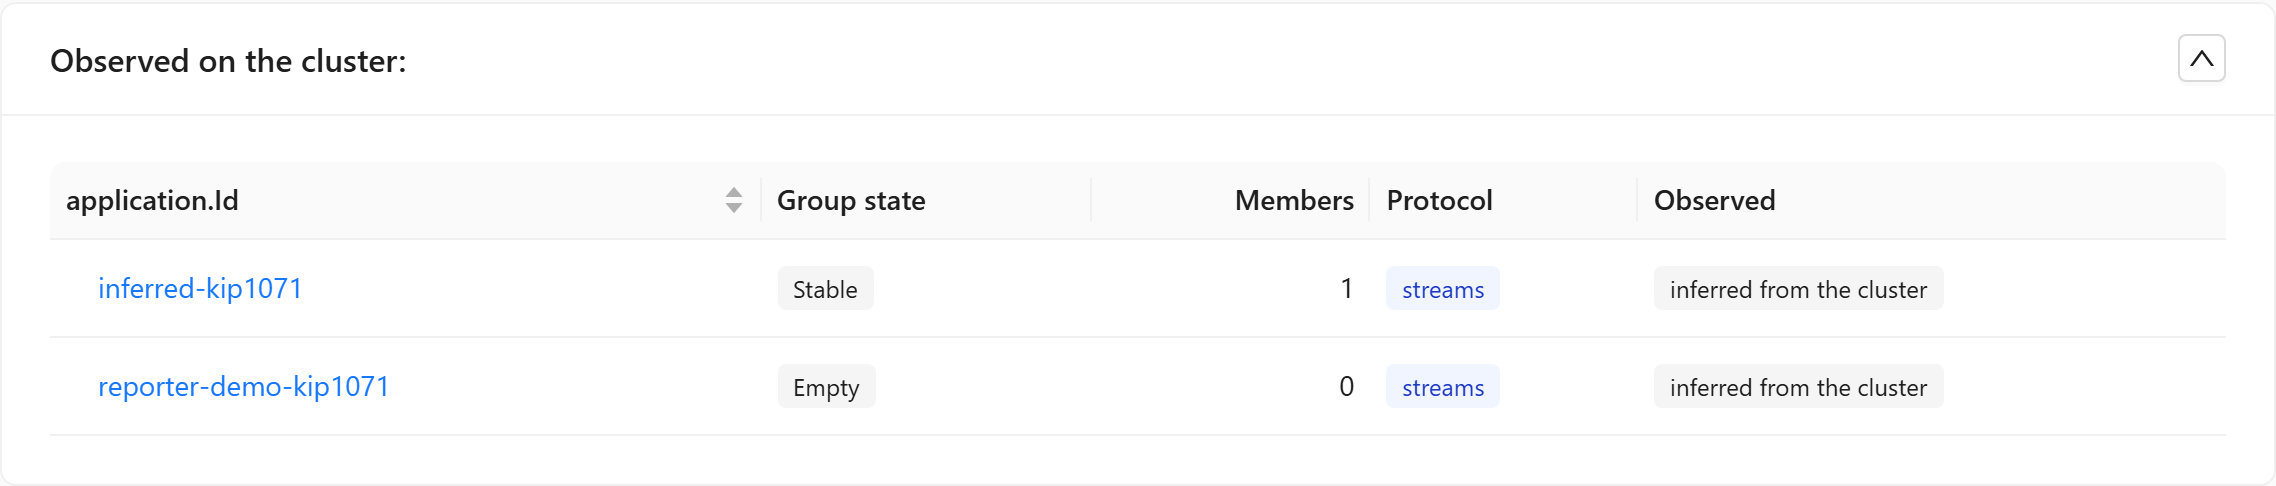
Observed on the cluster: two streams-protocol groups this instance does not run, with their group state and member count.
classic for a consumer group,
streams for a KIP-1071 group) and how the console observes it: hosted here links to the
stream’s detail page, inferred from the cluster opens the same State tab alone, under a banner
that says what this view can and cannot see.
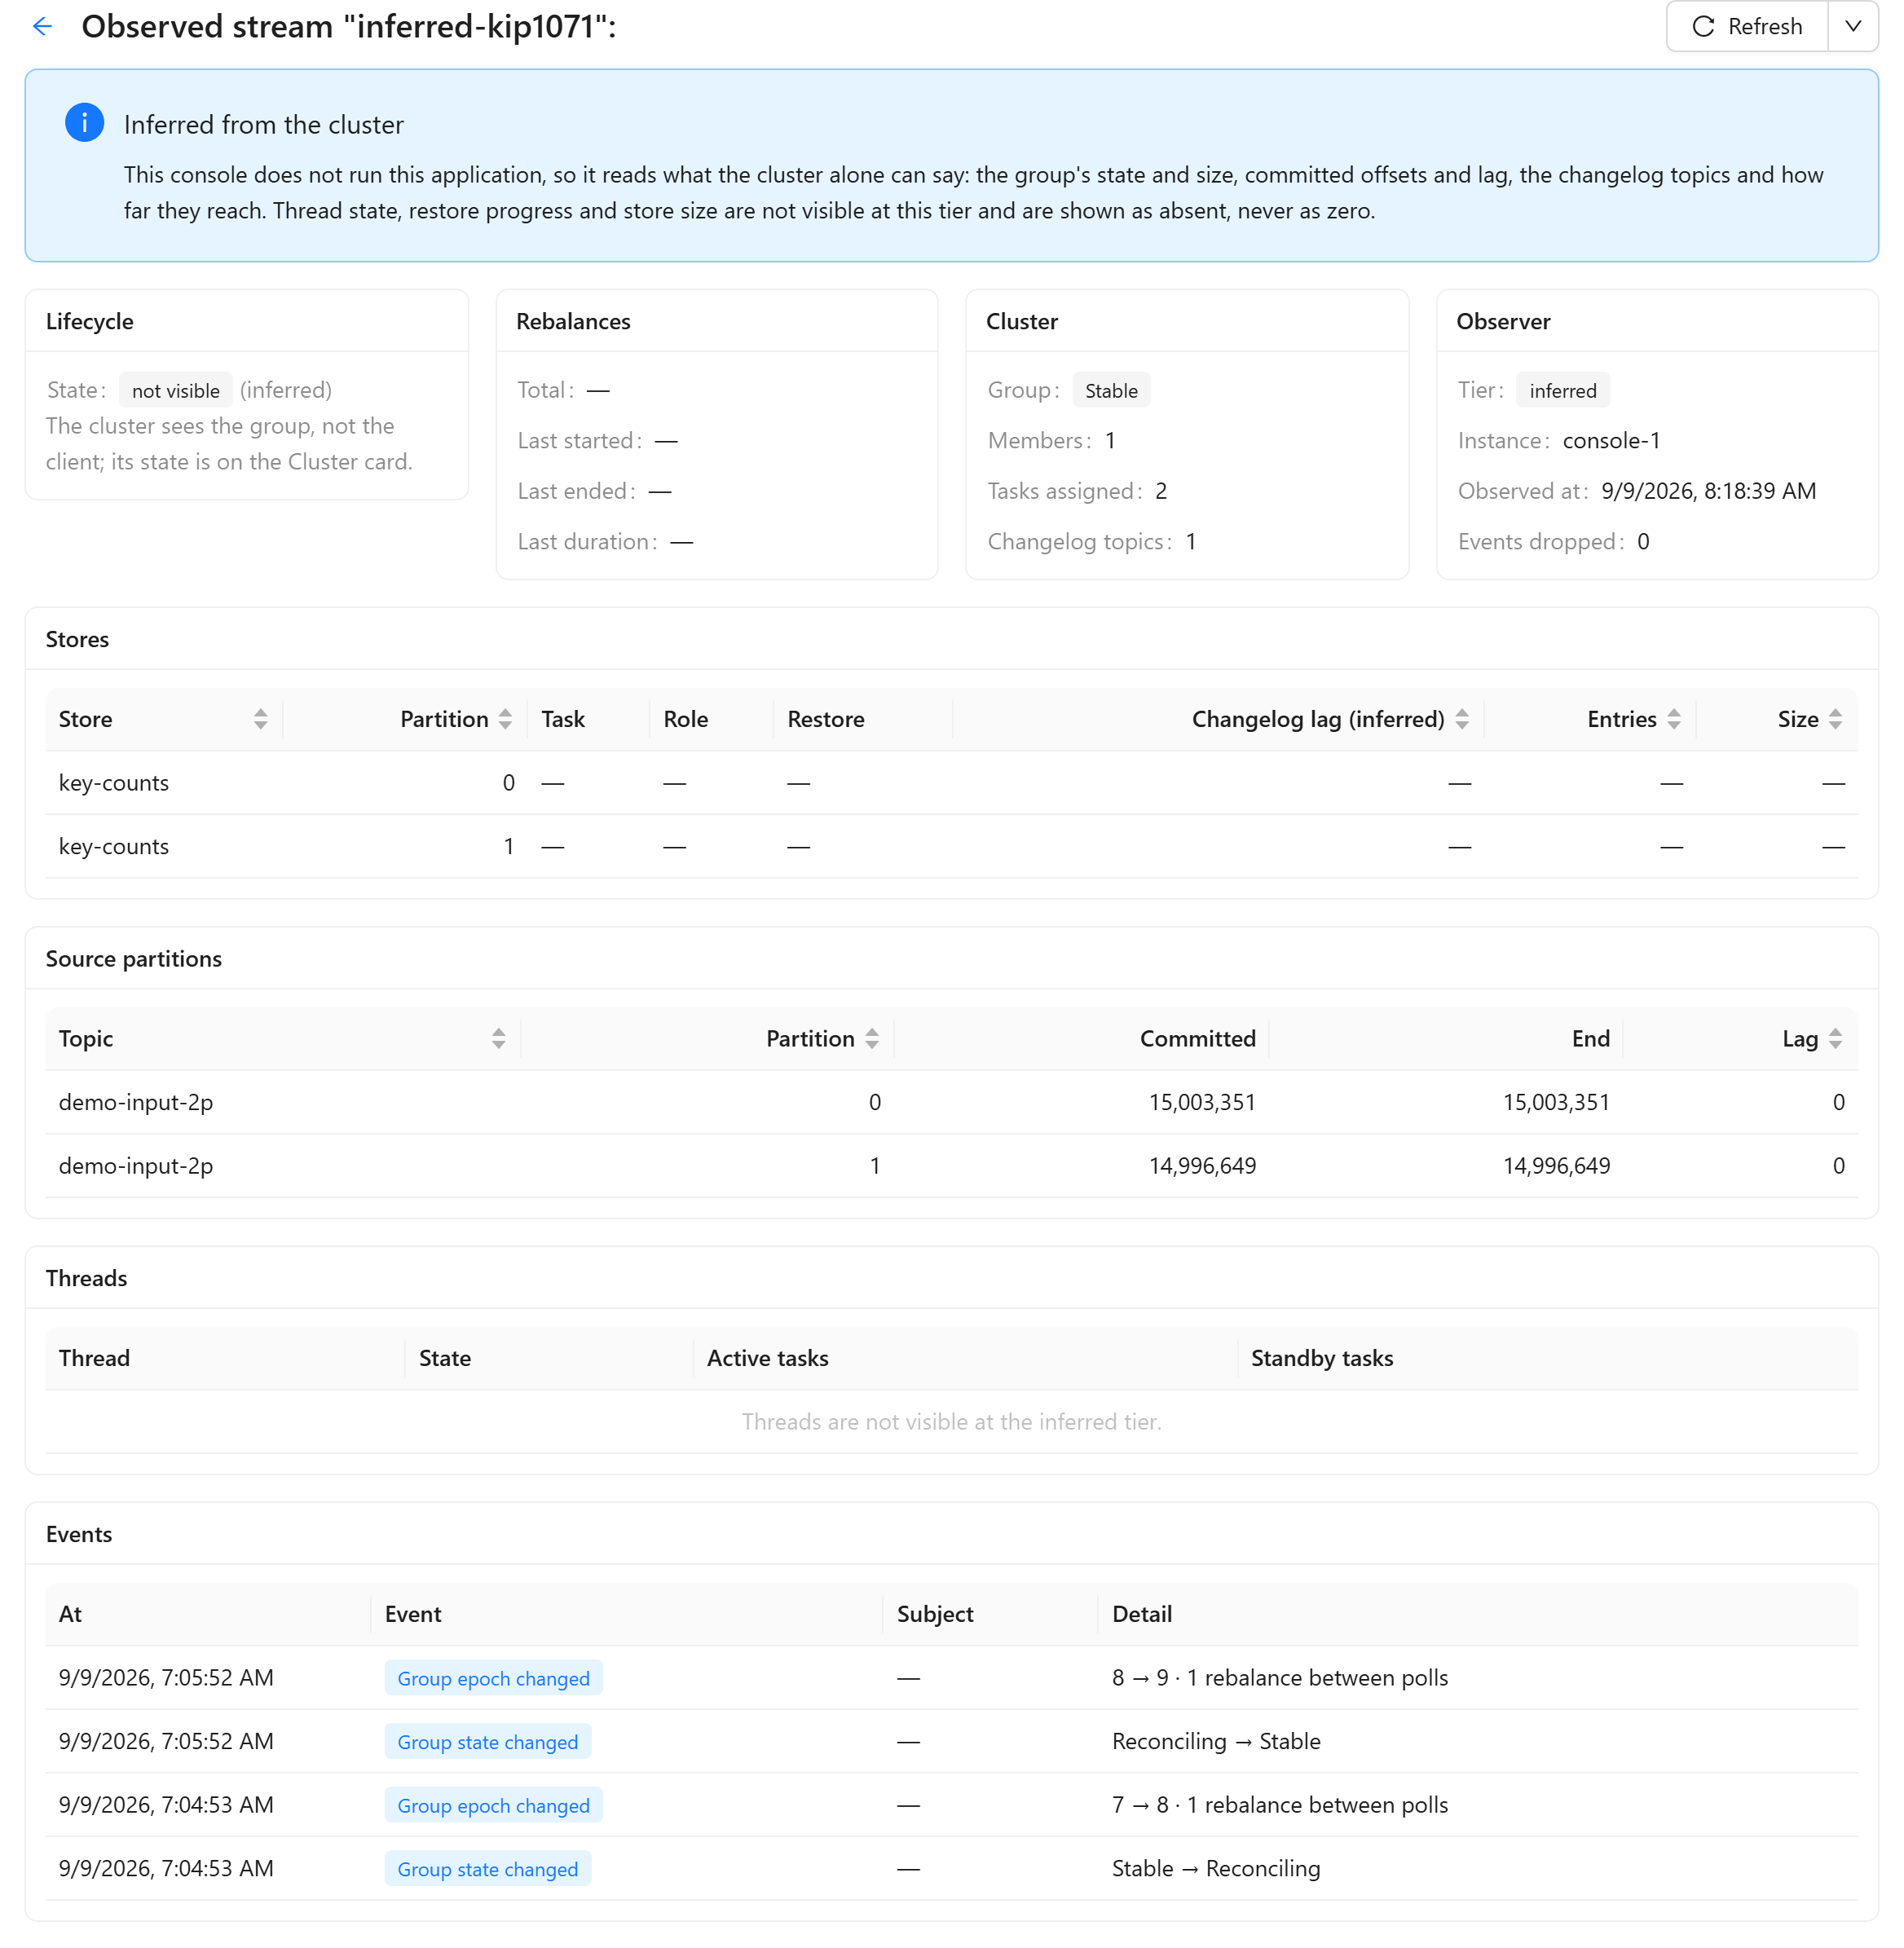
An application this instance does not run: the cluster's facts, the source partitions with lag, the changelog partitions' end offsets, and the group's state and epoch changes synthesised between reads.
Stable while threads die and the console refuses
to invent one; no restore progress, no store sizes, no threads. Two events are synthesised from
successive reads, since the cluster offers no listener: the group’s state changing, and for a
streams-protocol group its epoch rising, which counts the rebalances in between.
Observing needs
DESCRIBE on groups and topics, the usual read-only grant. If the console’s
principal lacks DESCRIBE on groups, Kafka silently leaves those groups out of the listing
rather than refusing. The table then says what it can still see: the -changelog and
-repartition topics on the cluster that no listed group owns, and the grant that would list
their applications. A known application id still opens /observedStream/<application.id>,
and any question the cluster refuses shows up there as an Access denied event naming the
resource and the operation.Per-node badges on the canvas
Switch to Stream Flow. Each node carries a badge with the measurements Kafka actually records for it: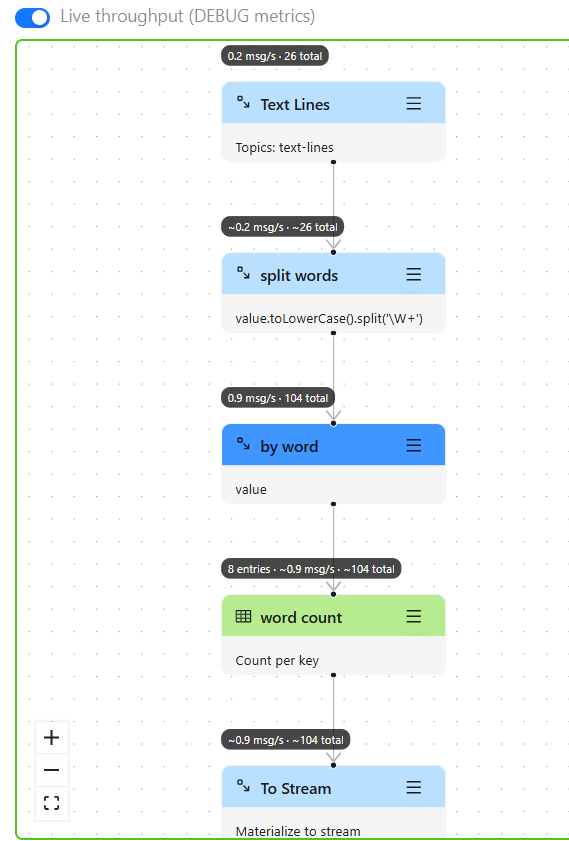
Word count on the Stream Flow tab, DEBUG metrics on: throughput per node, store entries on the count, health as the frame color.
N entriesis the live size of a stateful node’s store (aggregates, counts, reducers). Always on.N msg/s/N totalis throughput. Exact on source nodes and on grouping nodes (records crossing the repartition boundary); values prefixed with~are attributed from the surrounding subtopology, exact for linear chains and an upper bound around branches.- The canvas frame is colored by the stream’s state, green running and red error, so a screenshot of the tab is a health check in itself.
The DEBUG metrics toggle
Kafka Streams records throughput only at itsDEBUG metrics level, which is off by default
because it has runtime cost. The Live throughput (DEBUG metrics) switch above the canvas
turns it on for this stream only:
- Flip the switch. Alginte recycles the stream’s runtime client to apply the level, waiting for the previous client to release its state directory first. Offsets and state continue; processing resumes within seconds, longer for a large store.
- Throughput badges light up with real numbers as records flow.
- Flip it back off when you are done watching. The store-size badges and state coloring keep working either way.
Where the numbers come from
Everything on the State tab is one call,GET /api/kafka-streams/streams/{applicationId}/observation: the snapshot and the recent
events. Observed streams answer at GET /api/kafka-streams/observed and
GET /api/kafka-streams/observed/{applicationId}/observation. The canvas badges are served by
GET /api/kafka-streams/streams/{applicationId}/node-metrics, a projection of the same snapshot
grouped per canvas node, and the raw runtime metrics remain on the Metrics tab. Refresh
follows the page’s auto-refresh control, so every view updates on whatever cadence you set.
From the blog
- Monitoring Kafka Streams applications: the state a cluster view cannot show: what the process knows and the cluster does not (a store restoring, a standby lagging, a thread lost), and why the State tab reads it from the application.